DOFMaster
for Windows
On-line
Depth of Field
Calculator
DOFMaster for Mobile Devices
On-line
Depth of Field
Table
Hyperfocal
Distance Chart
Articles
FAQ
Recommended
Books
Support
Contact
Links
Home
for Windows
On-line
Depth of Field
Calculator
DOFMaster for Mobile Devices
On-line
Depth of Field
Table
Hyperfocal
Distance Chart
Articles
FAQ
Recommended
Books
Support
Contact
Links
Home
As an Amazon Associate I earn from qualifying purchases.
![]()
appropriate) must be developed for the variety of
films to be processed in it. Given time, temperature,
you will be able to see the results on these time
charts.
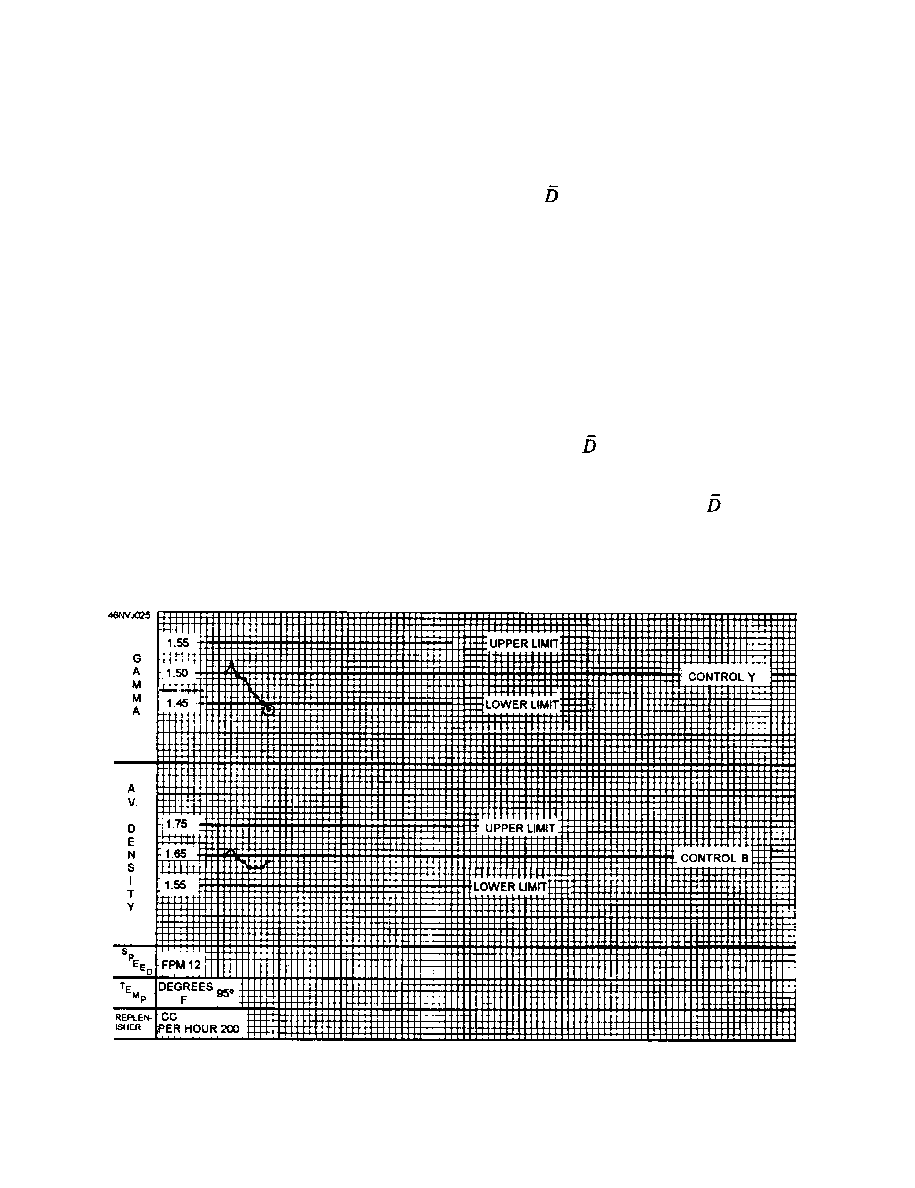
ing run. Each sensitometric strip should be read with
a densitometer and plotted on the appropriate pro-
cess-monitoring chart. As a minimum, you should
process and plot a control strip after start-up and
before shut down or at the beginning and end of each
work shift. Once the densities are recorded and
plotted, an accurate graphic representation of the
physical process. A list of numbers can be studied
carefully to see whether they are out of line; however,
instantly whether there is data out of order.
and maximum density (D-min and D-max), average
your quality assurance program. To be useful in your
quality assurance program, you must collect and
record data relative to these and other specific
mean or average, and determine the upper and lower
is 1.65, you must have a method for indicating when
Advanced Photography Course
As an Amazon Associate I earn from qualifying purchases.
WWW.DOFMASTER.COM
© 2006 Don Fleming. All rights reserved.
© 2006 Don Fleming. All rights reserved.